
What is Chartistic?
Chartistic = Chart + artistic. The goal of Chartistic is to find creative ways of gathering and displaying data (some of which is in the form of an artwork). Information on the various charts and interpretation follows.
Reach your age
Participants were invited to reach as high as they can with their feet flat on the ground and place a sticker in line with their age. From this we can measure standing reach. In the image below we can see a linear trend of increasing reach from 2 -12, a peak reach at ~16, and pretty flat after that. Interestingly you can see a big cluster of stickers between 35 and 50, which I interpret is the average age of parents who bring their children to science festival events!
Favourite beaches
Participants used a large compass to draw to draw an arc out to sea from their favourite beach. The radius of the arc represents the distance from their house. St Kilda/St Clair Beach have the most rings coming from them, but all the beaches are pretty popular. Distance wasn’t too much of a factor for people’s favourite beaches.
Reach your age chart.
Favourite Beaches, demonstrating arc drawing.
Favourite beaches. Final chart.
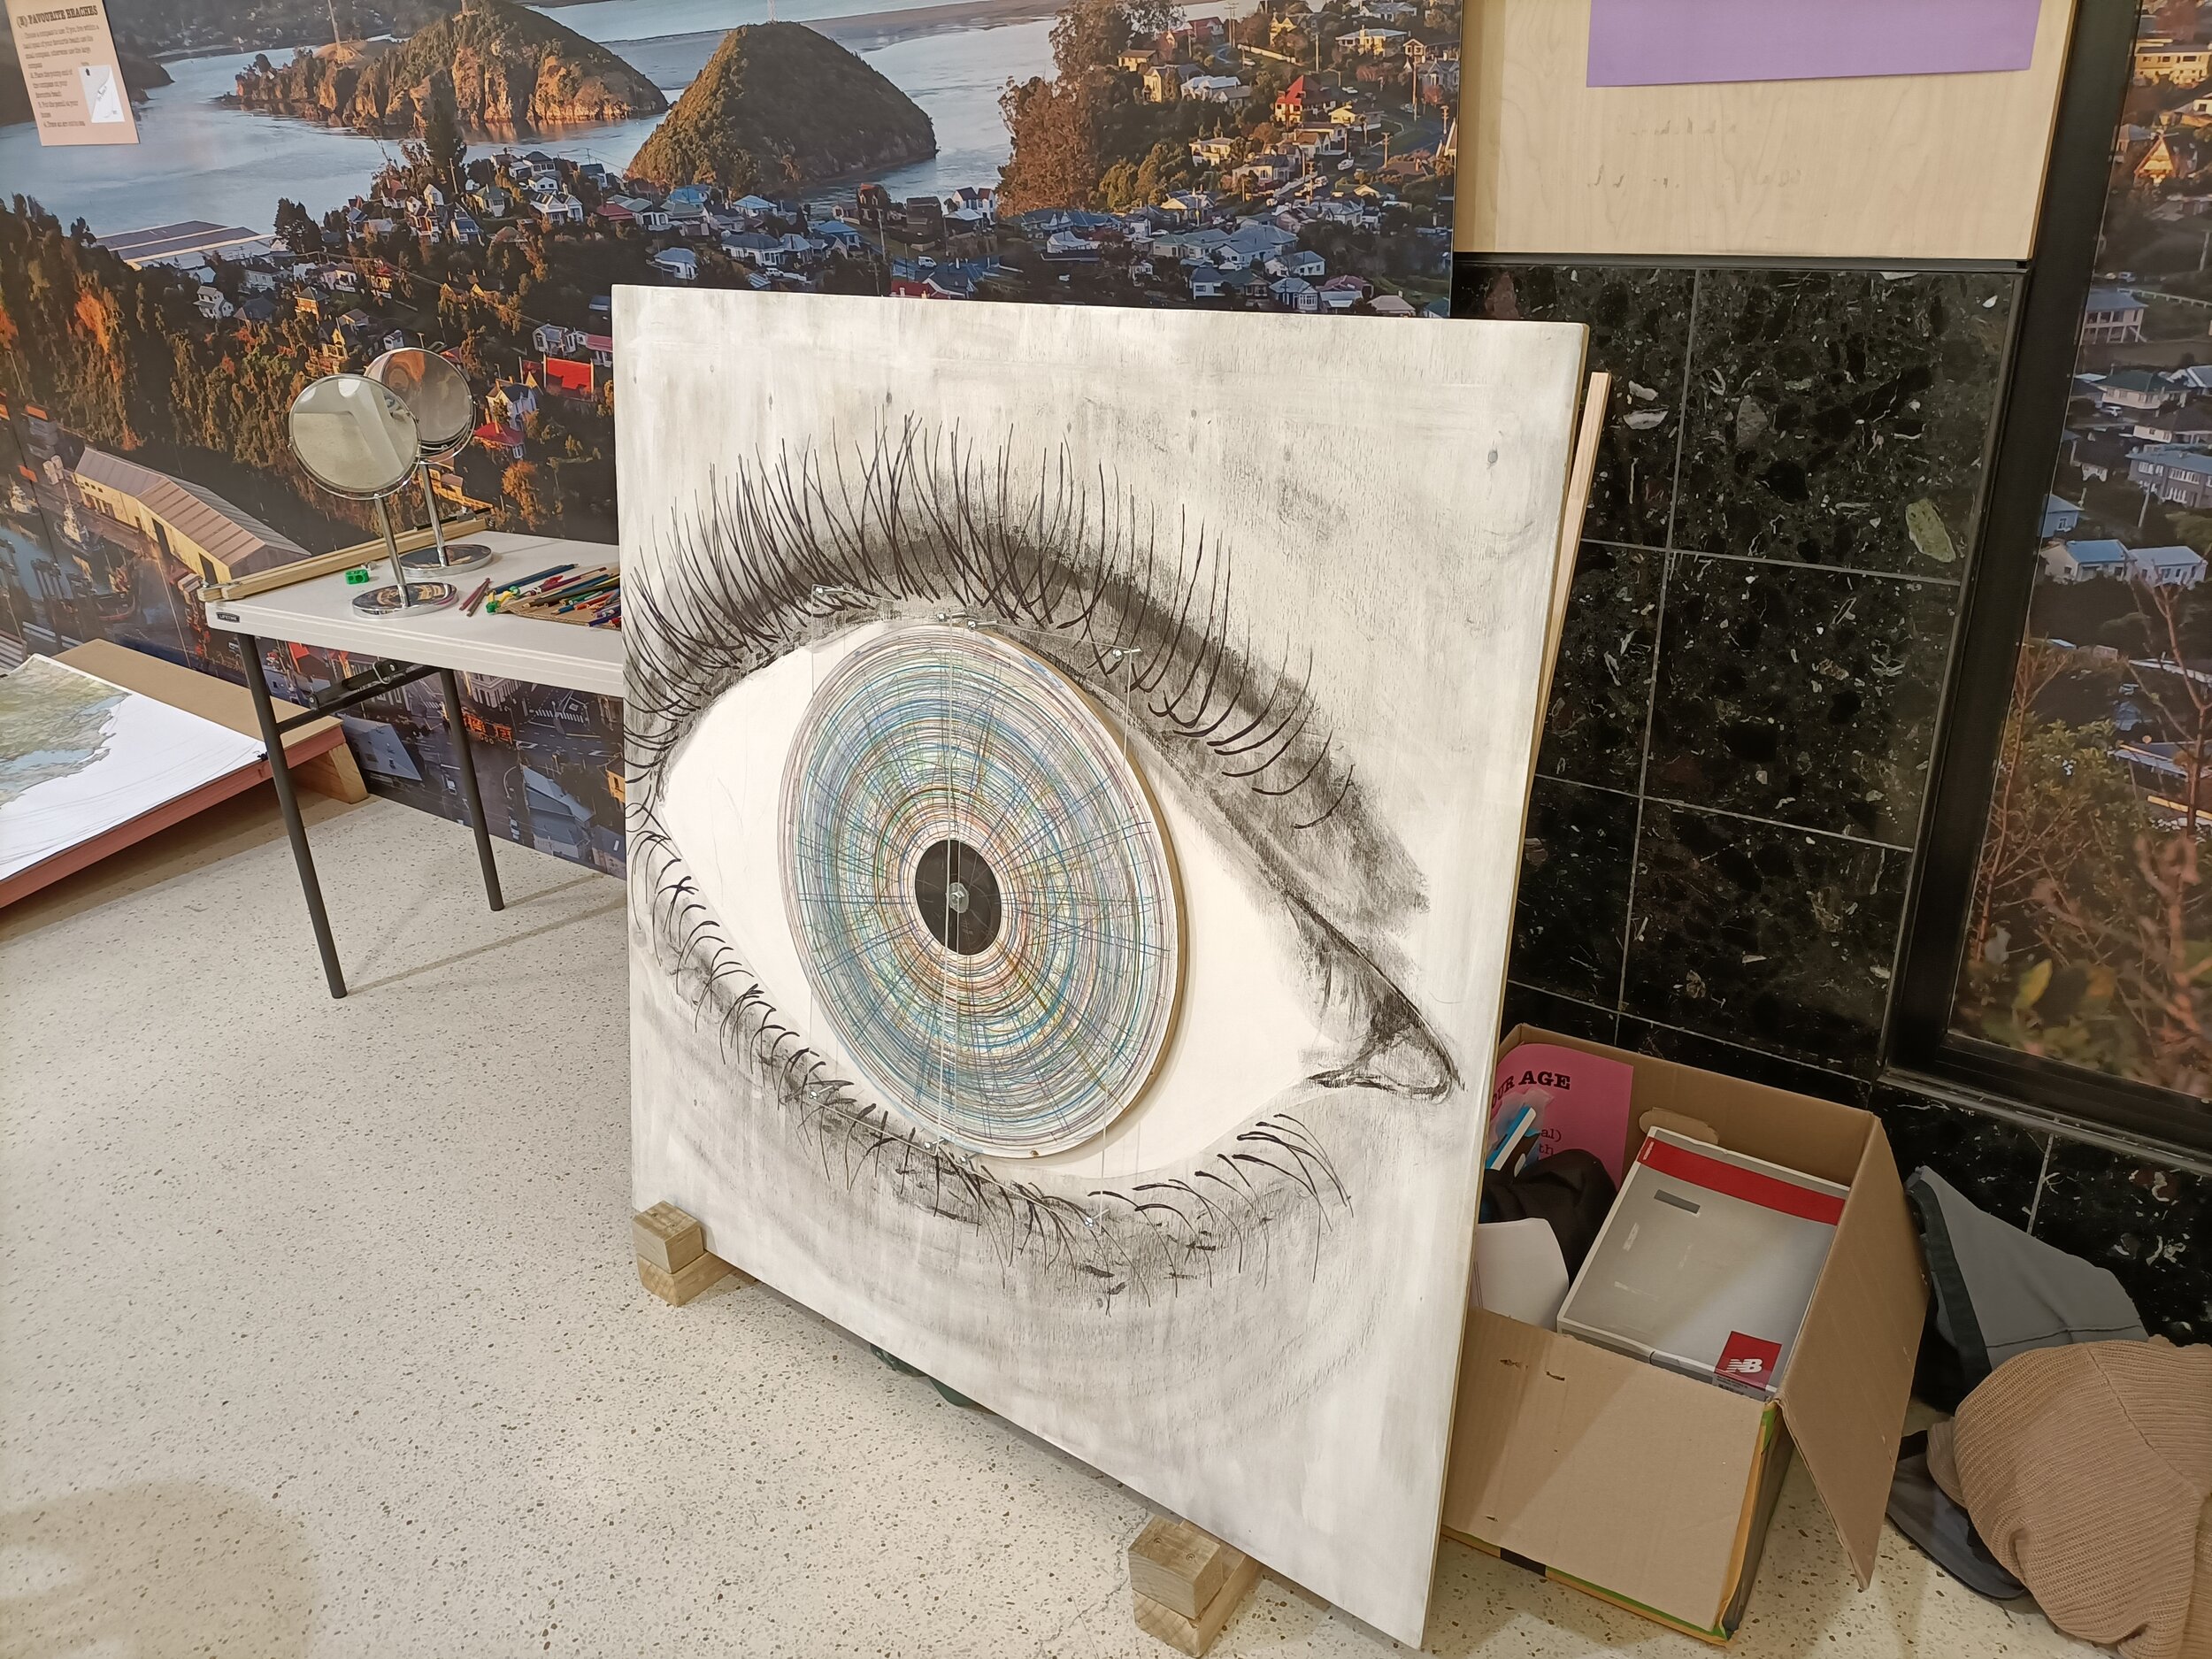
Average eye
Participants were invited to pick out up to 3 coloured pencils and draw for 30 seconds on a spin-able iris. The combination of all these different colours represents the ‘Average eye’. Below are some images/video showing the average eye being drawn on and the finished result.


Draw your age
Participants drew a picture on a sticker and put it on a chart in line with their age. The first two days of the event we drew faces. The last two days we drew rockets. We can see in the data that children starting being able to draw recognisable faces around age 6-7.
Cool dice
Participants made and drew on tetrahedral dice. They then rolled their die twice and added up the result. They placed their die in a histogram according to the sum of their rolls.
We can work out what combinations can create each total and therefore the probability for each result:
2 = 1+1 (1)
3 = 1+2 , 2+1 (2)
4 = 1+3, 2+2, 3+1 (3)
5 = 1+4, 2+3, 3+2, 4+1 (4)
6 = 2+4, 3+3, 4+2 (3)
7 = 3+4, 4+3 (2)
8 = 4+4 (1)
That is 16 different combinations (4^2). We can divide the total number of tetrahedrons made (125) by 16 = 8.4375 and multiply this number by the ideal proportions (in brackets) above. This will give use the ideal probability which we can compare with our collected data. They data matches fairly well.
Bonus: platonic solids
I also made a worksheet that extends on the tetrahedral ‘Cool dice’, by exploring other platonic solids. Image and link to pdf below.
Cool Dice Totals vs Ideal probability

Chartistic event and reception
Chartistic was part of the NZ International Science Festival. Chartistic was held in the back of the ground floor of Meridian Mall from the 15th to the 18th of July 2021 (11am-3pm daily).
It was well received by participants. We can look at the number of dots on ‘Reach your age’ to get an overall estimate of participation at 264.


Acknowledgments
Thanks to NZ International Science Festival for funding this event and providing the space and support. Thanks Dan, Andrea and Hannah. Thanks to Meridian Mall for hosting this event. Thanks to my wonderful volunteers: Chanti, Lucas, Brendan, Anna, and Sophie.